Metrics & health
Kubus reads CPU and memory from metrics-server and keeps a short rolling history, so you get little trend charts rather than a single instantaneous number.
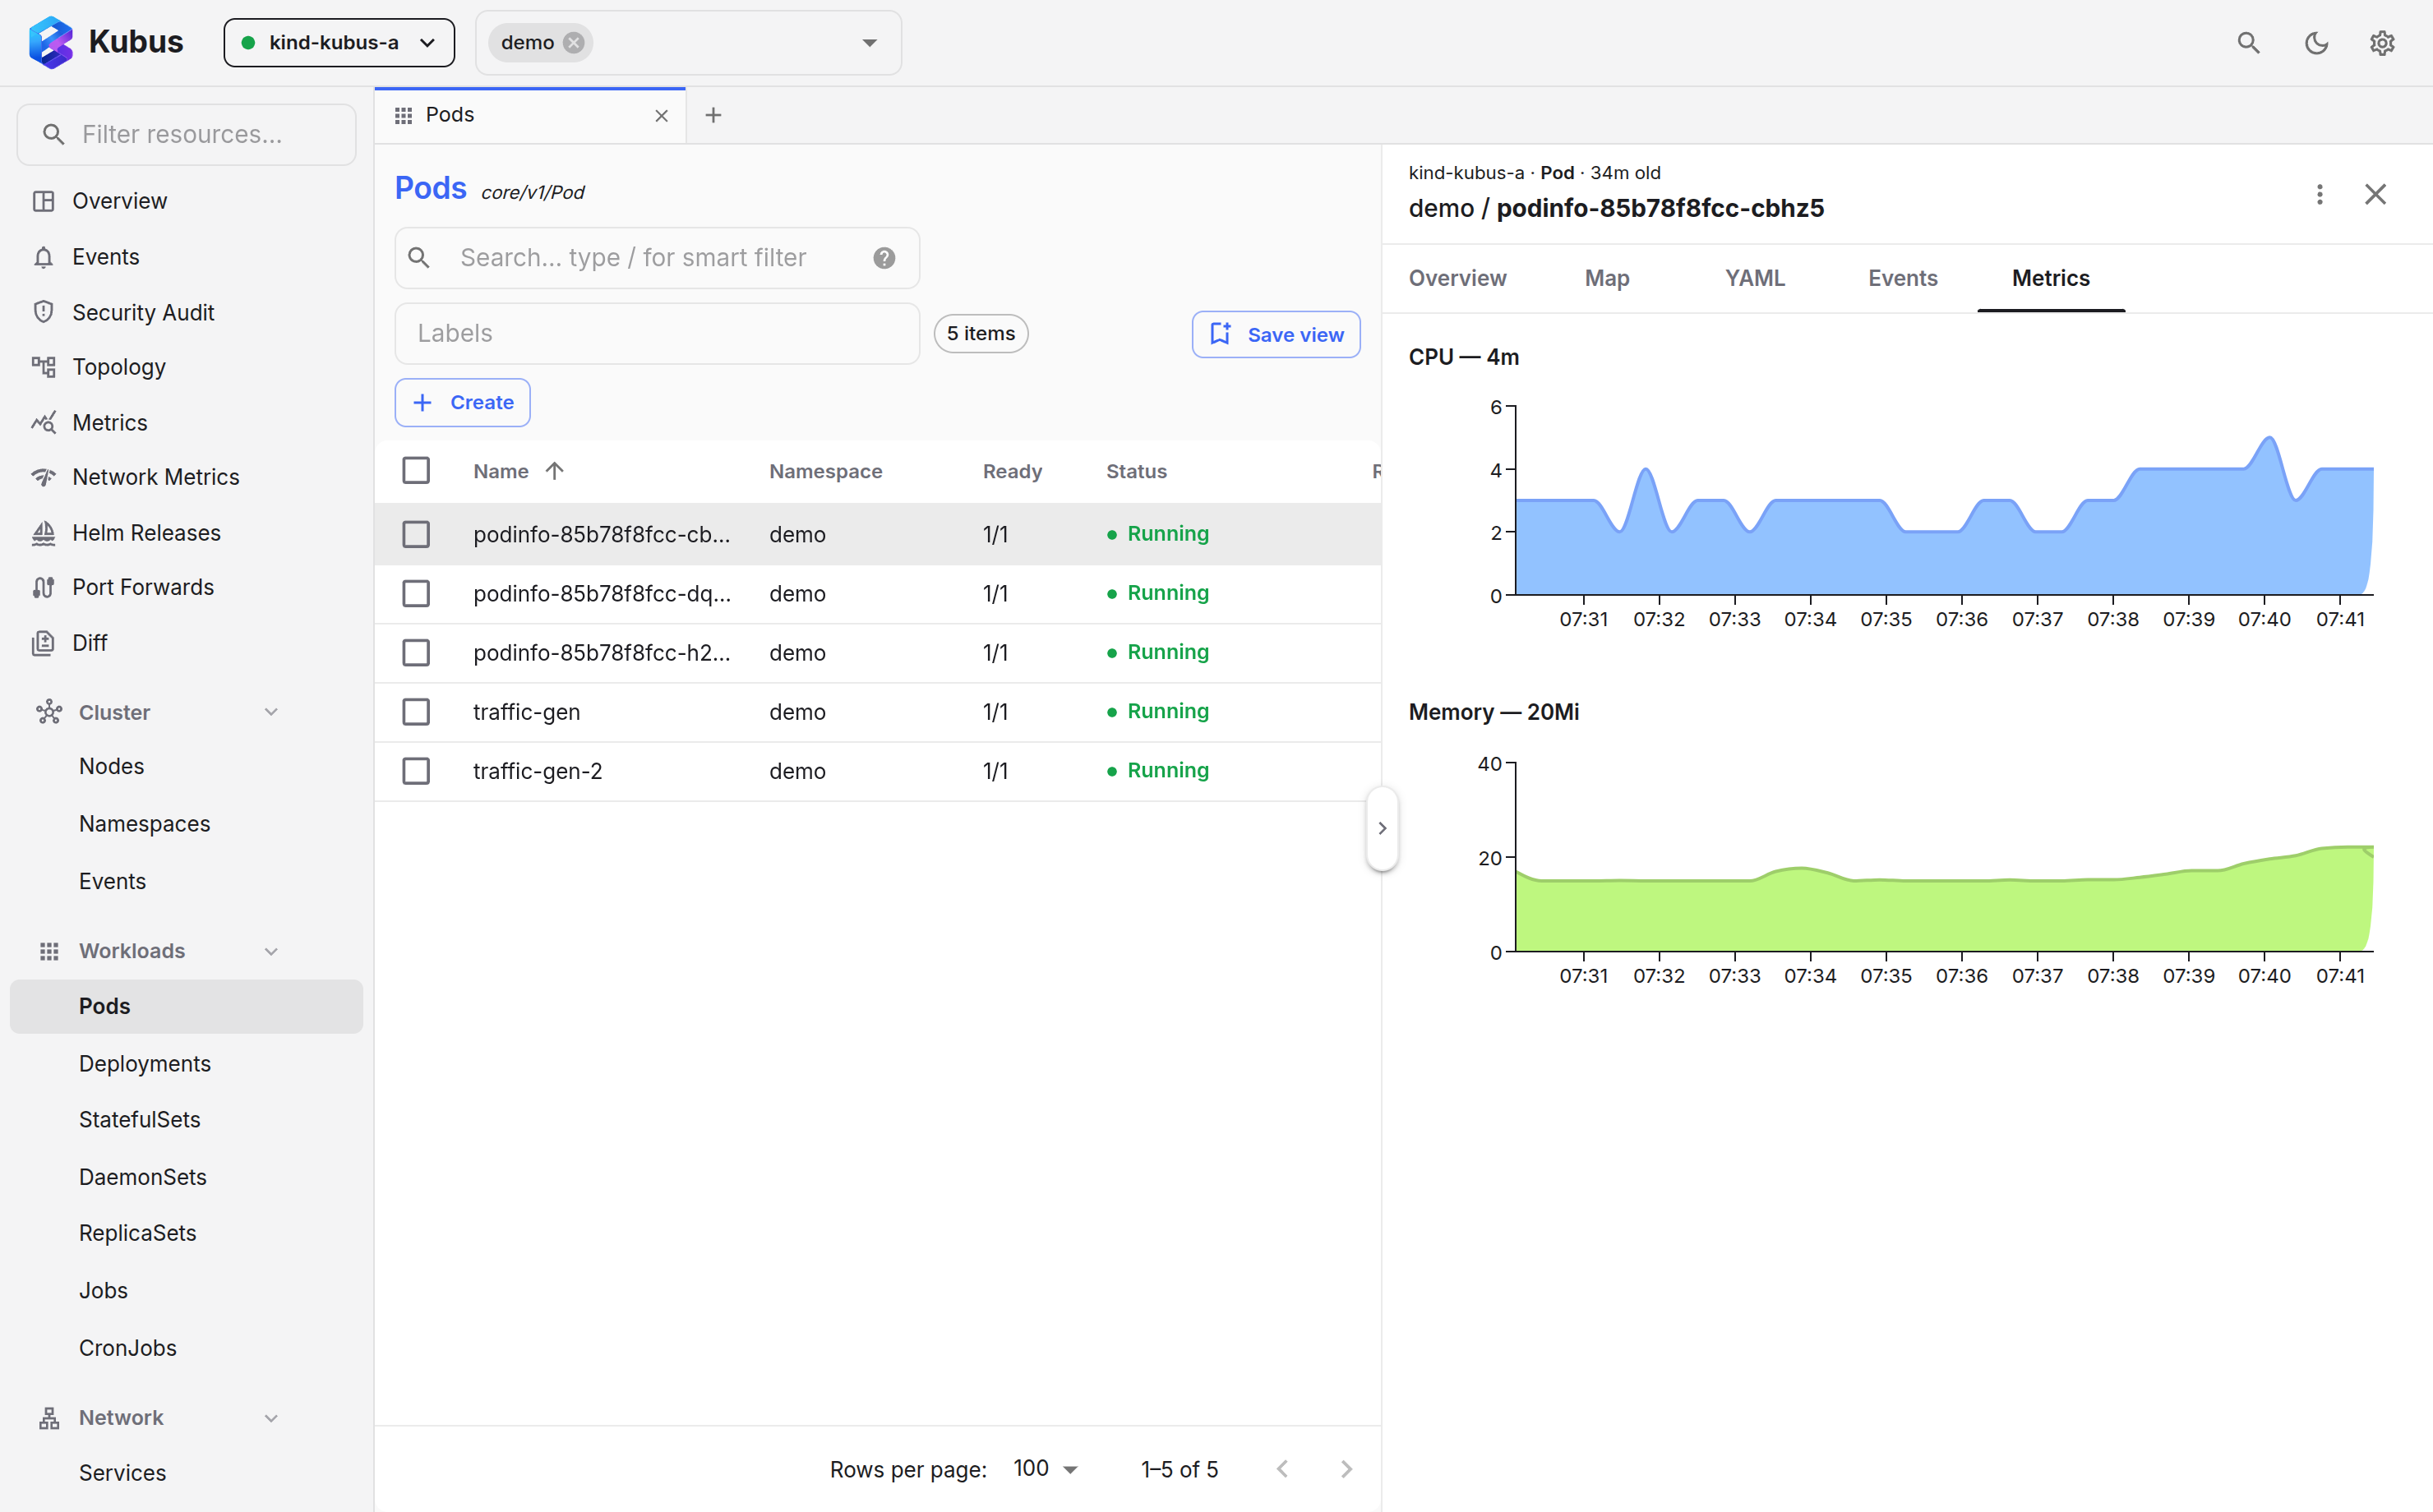
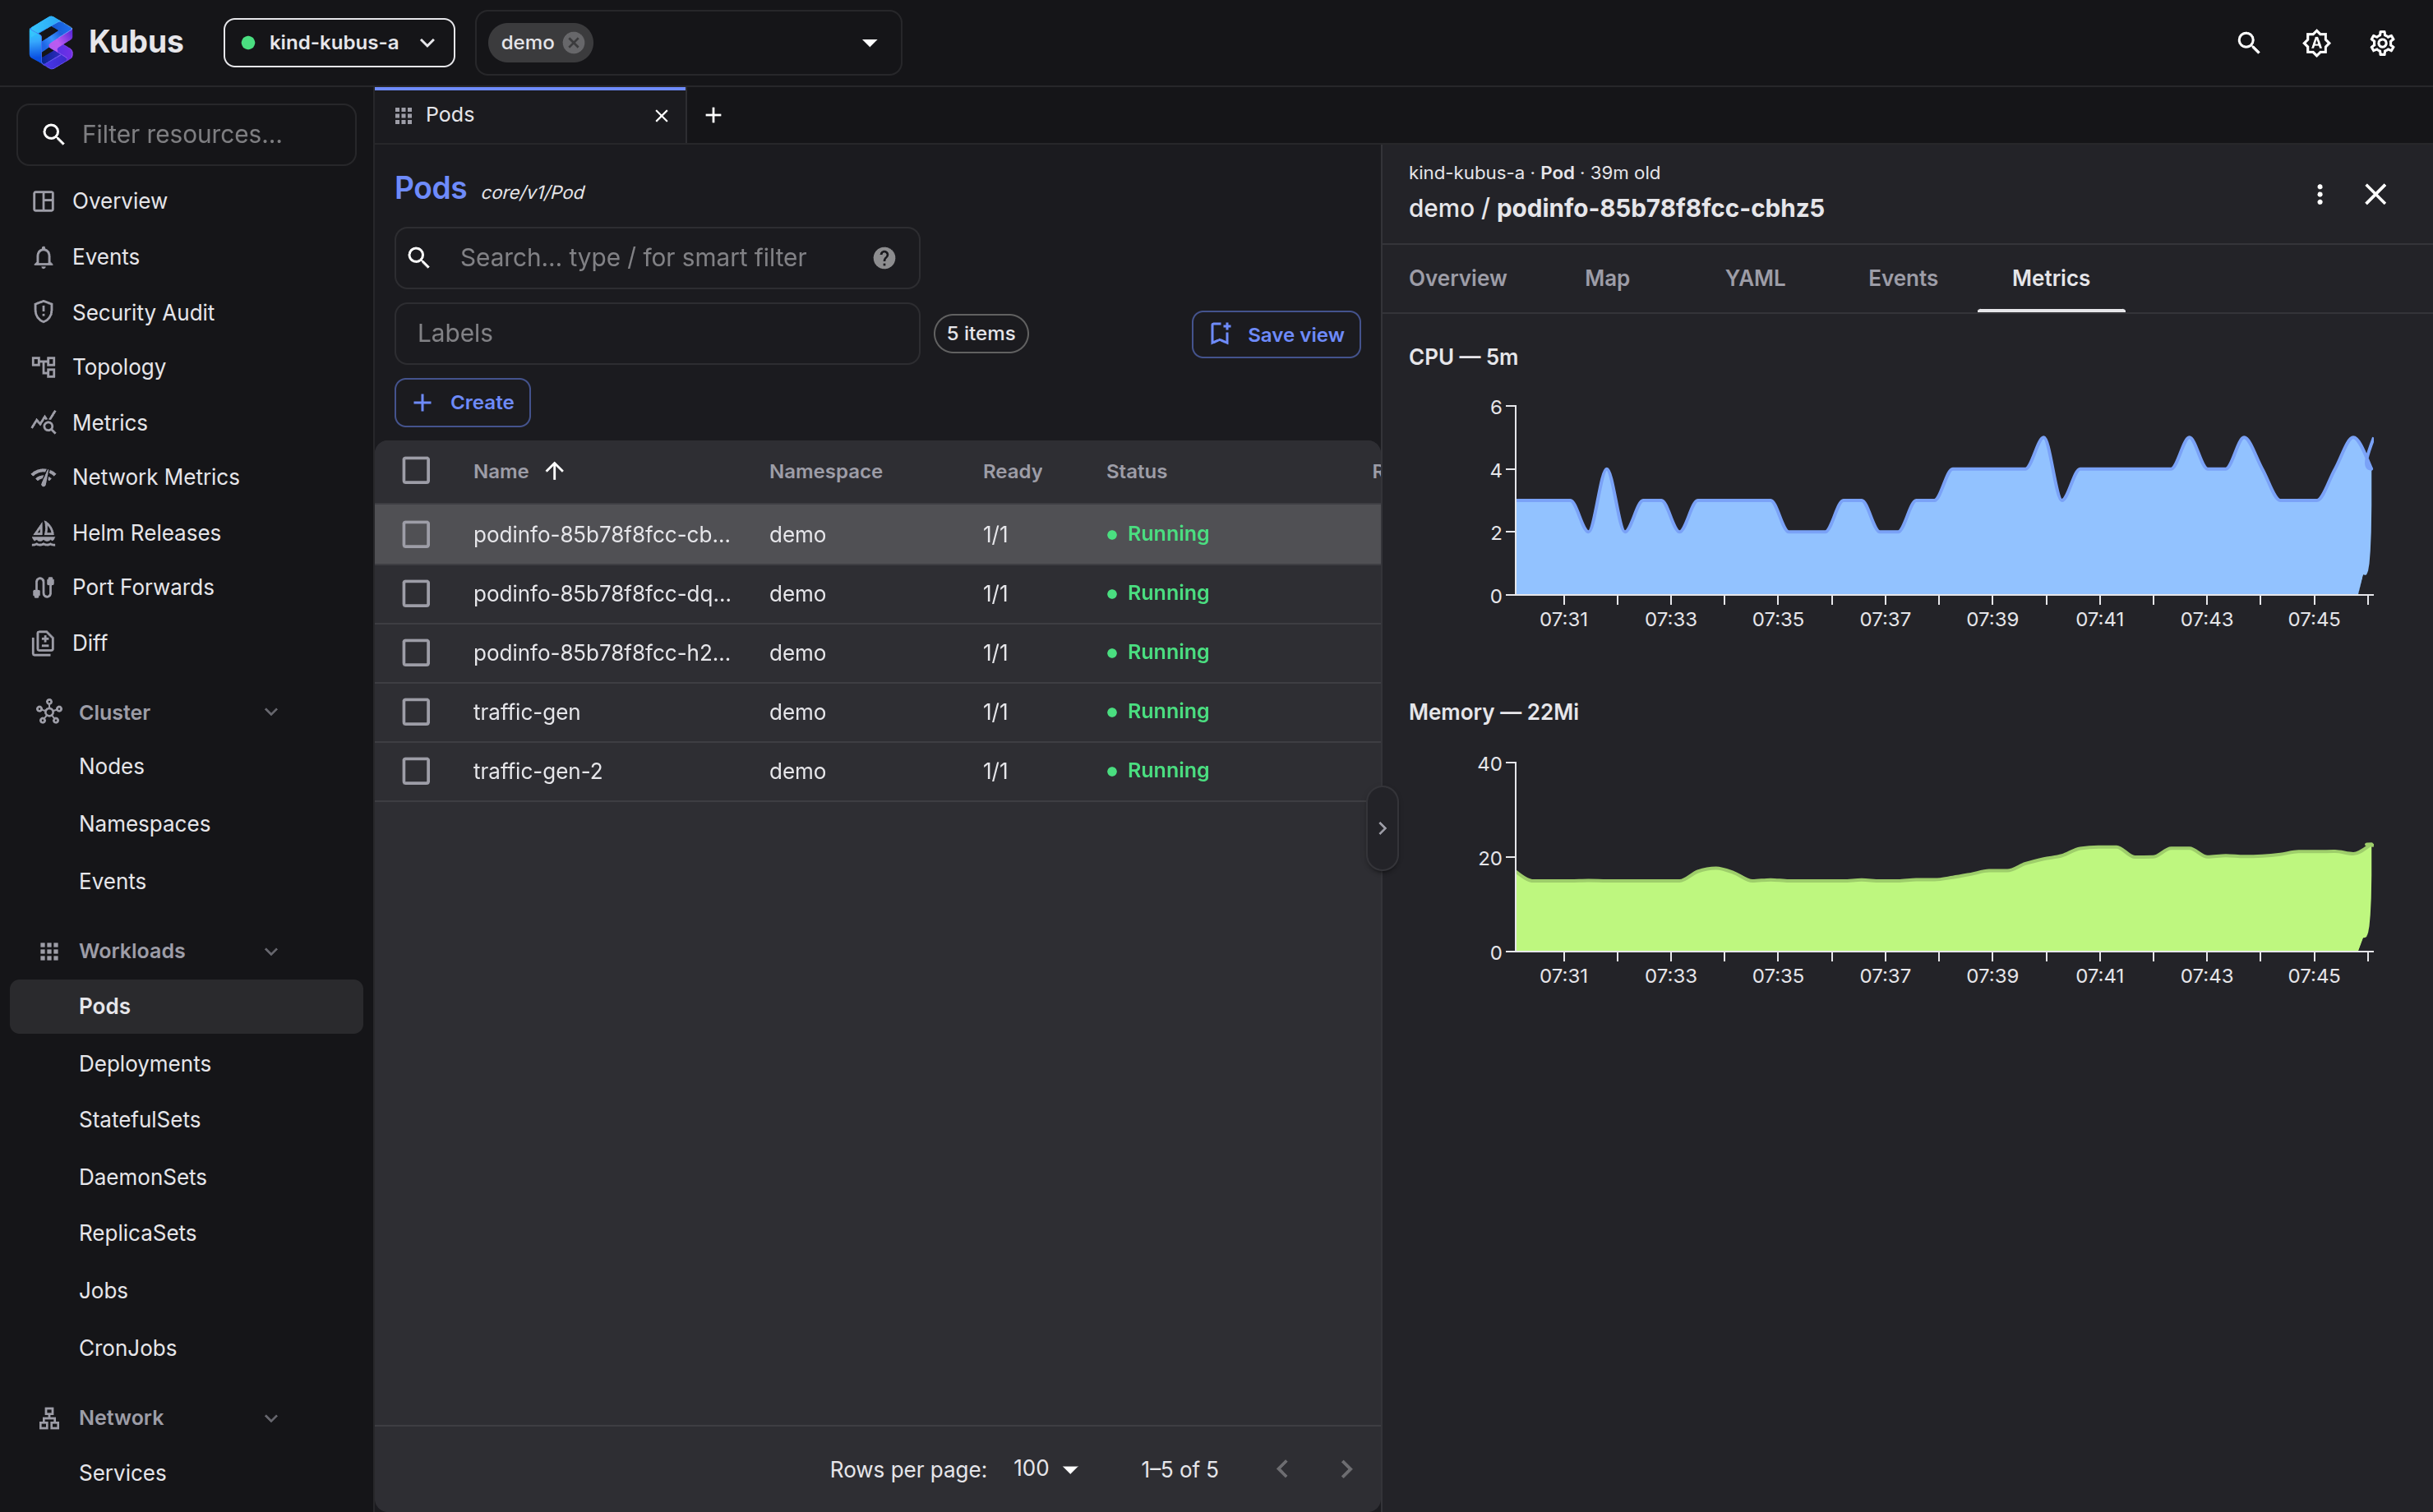
Where you'll see metrics
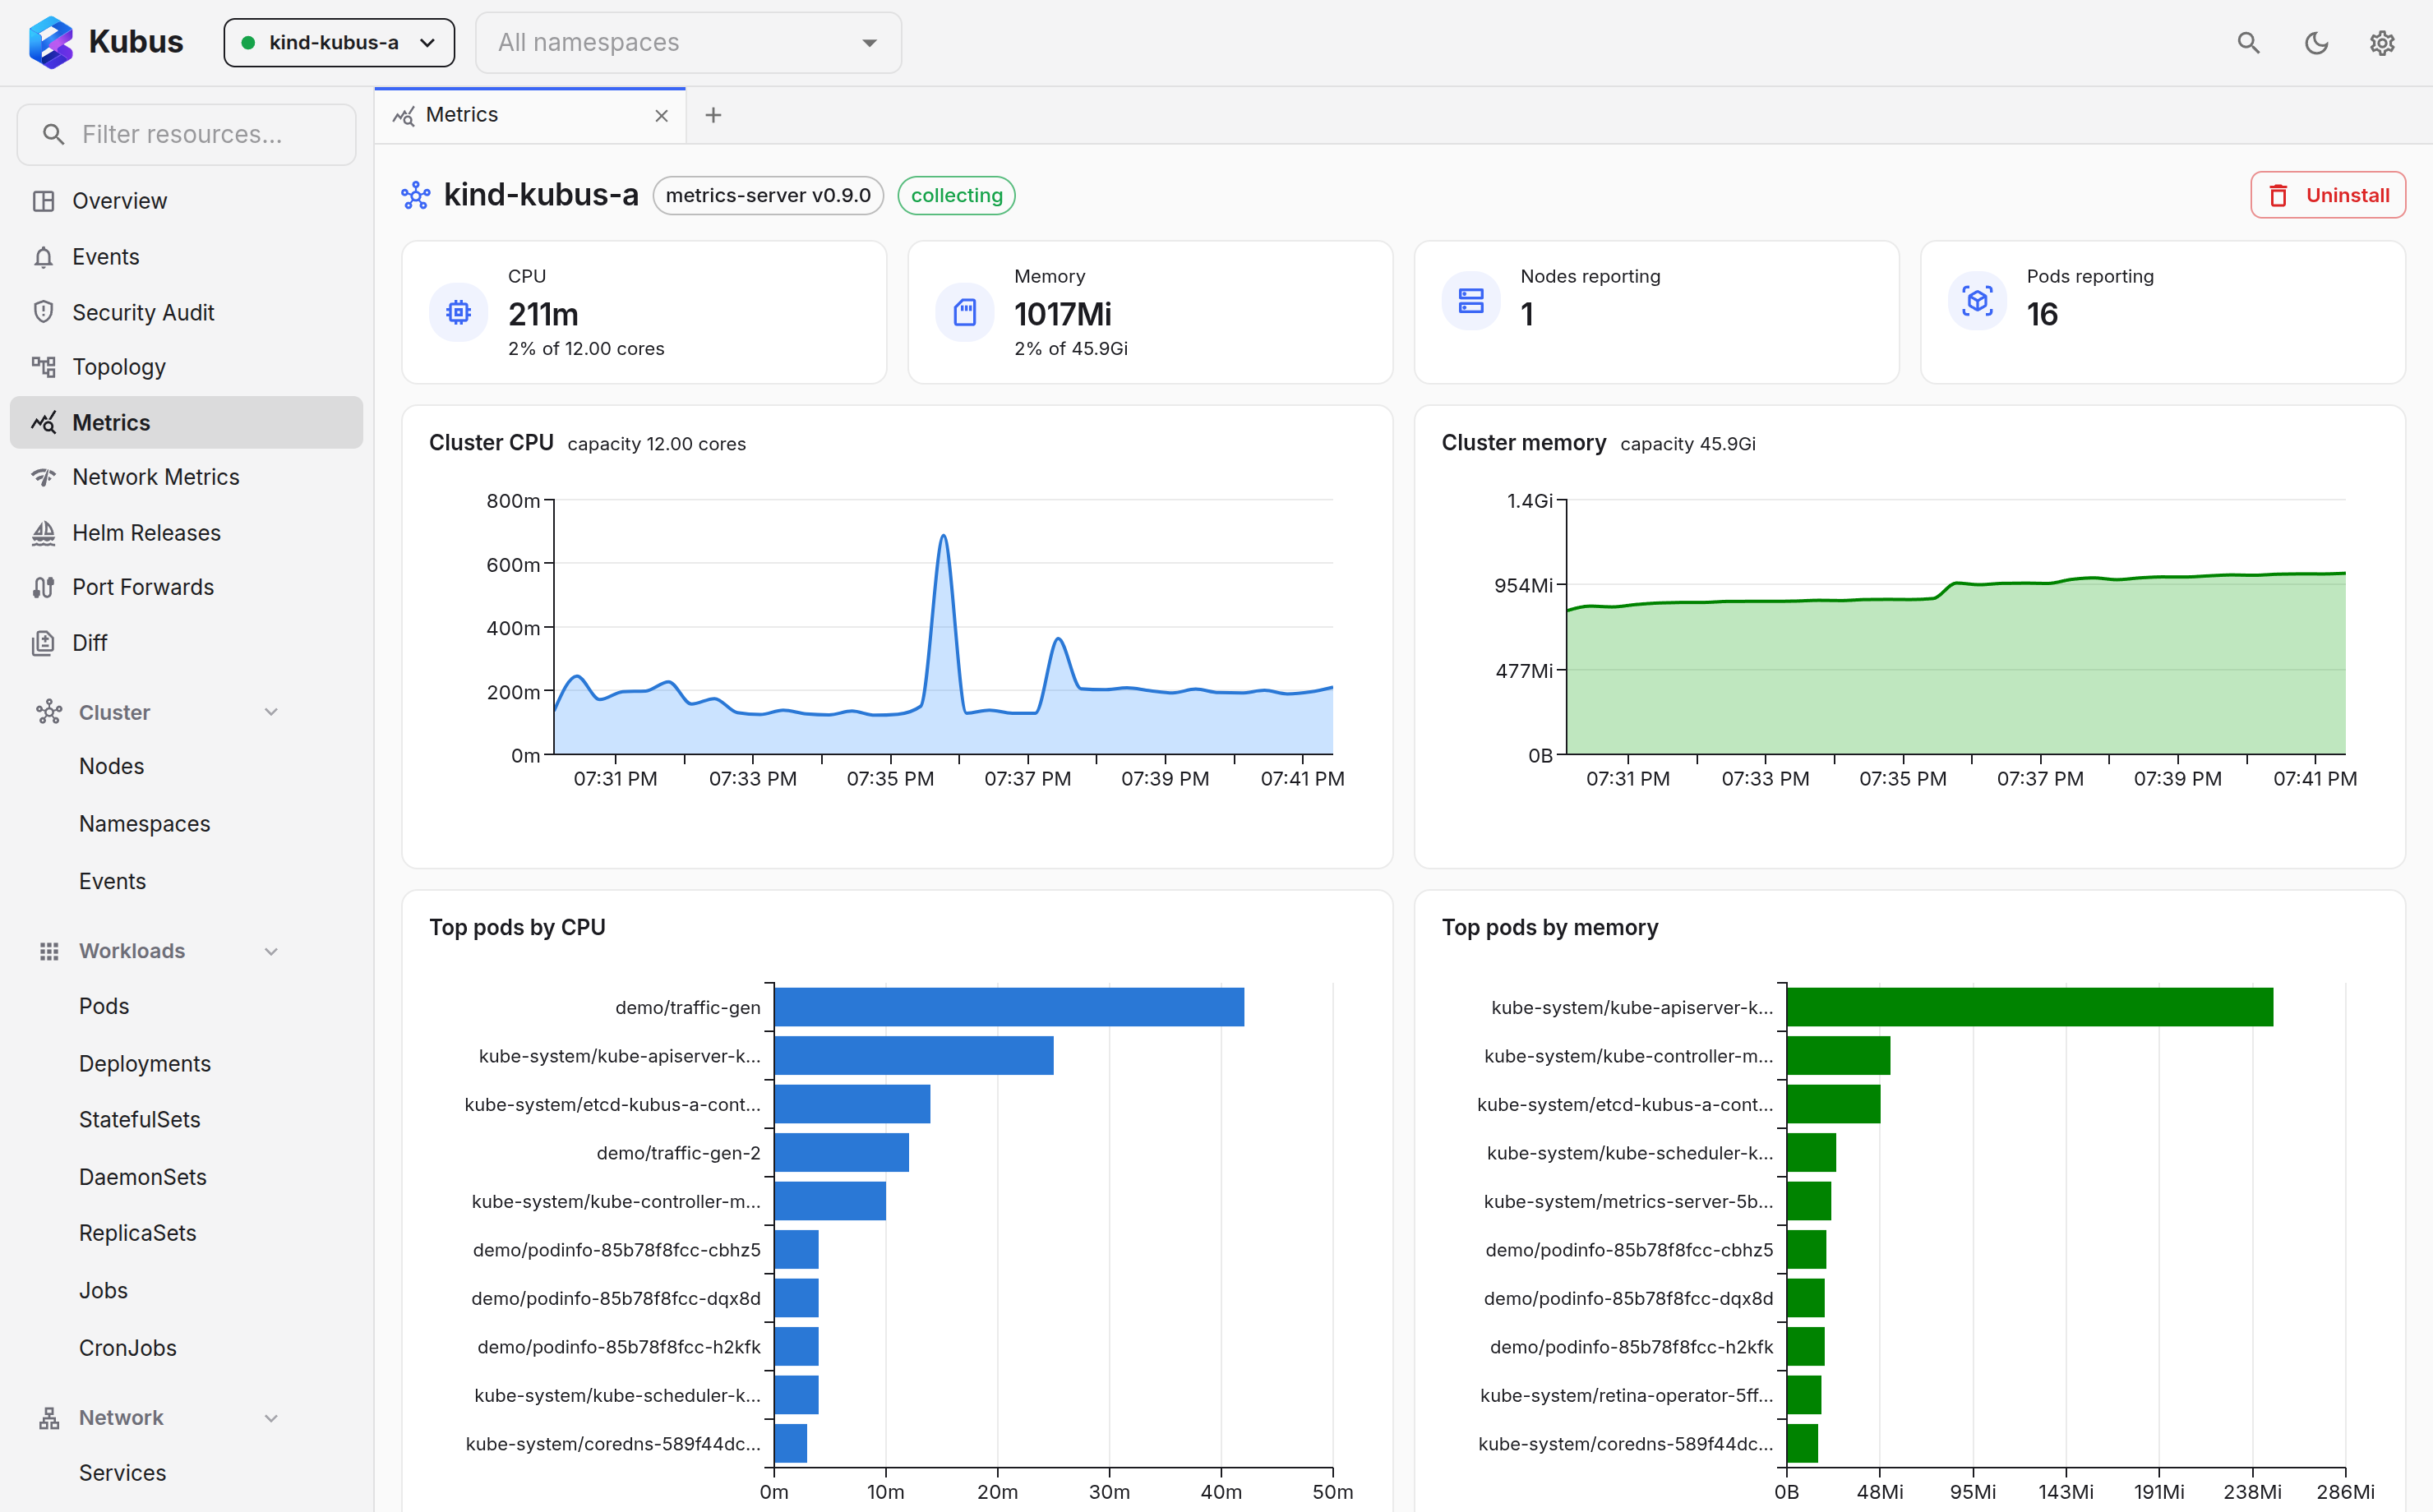
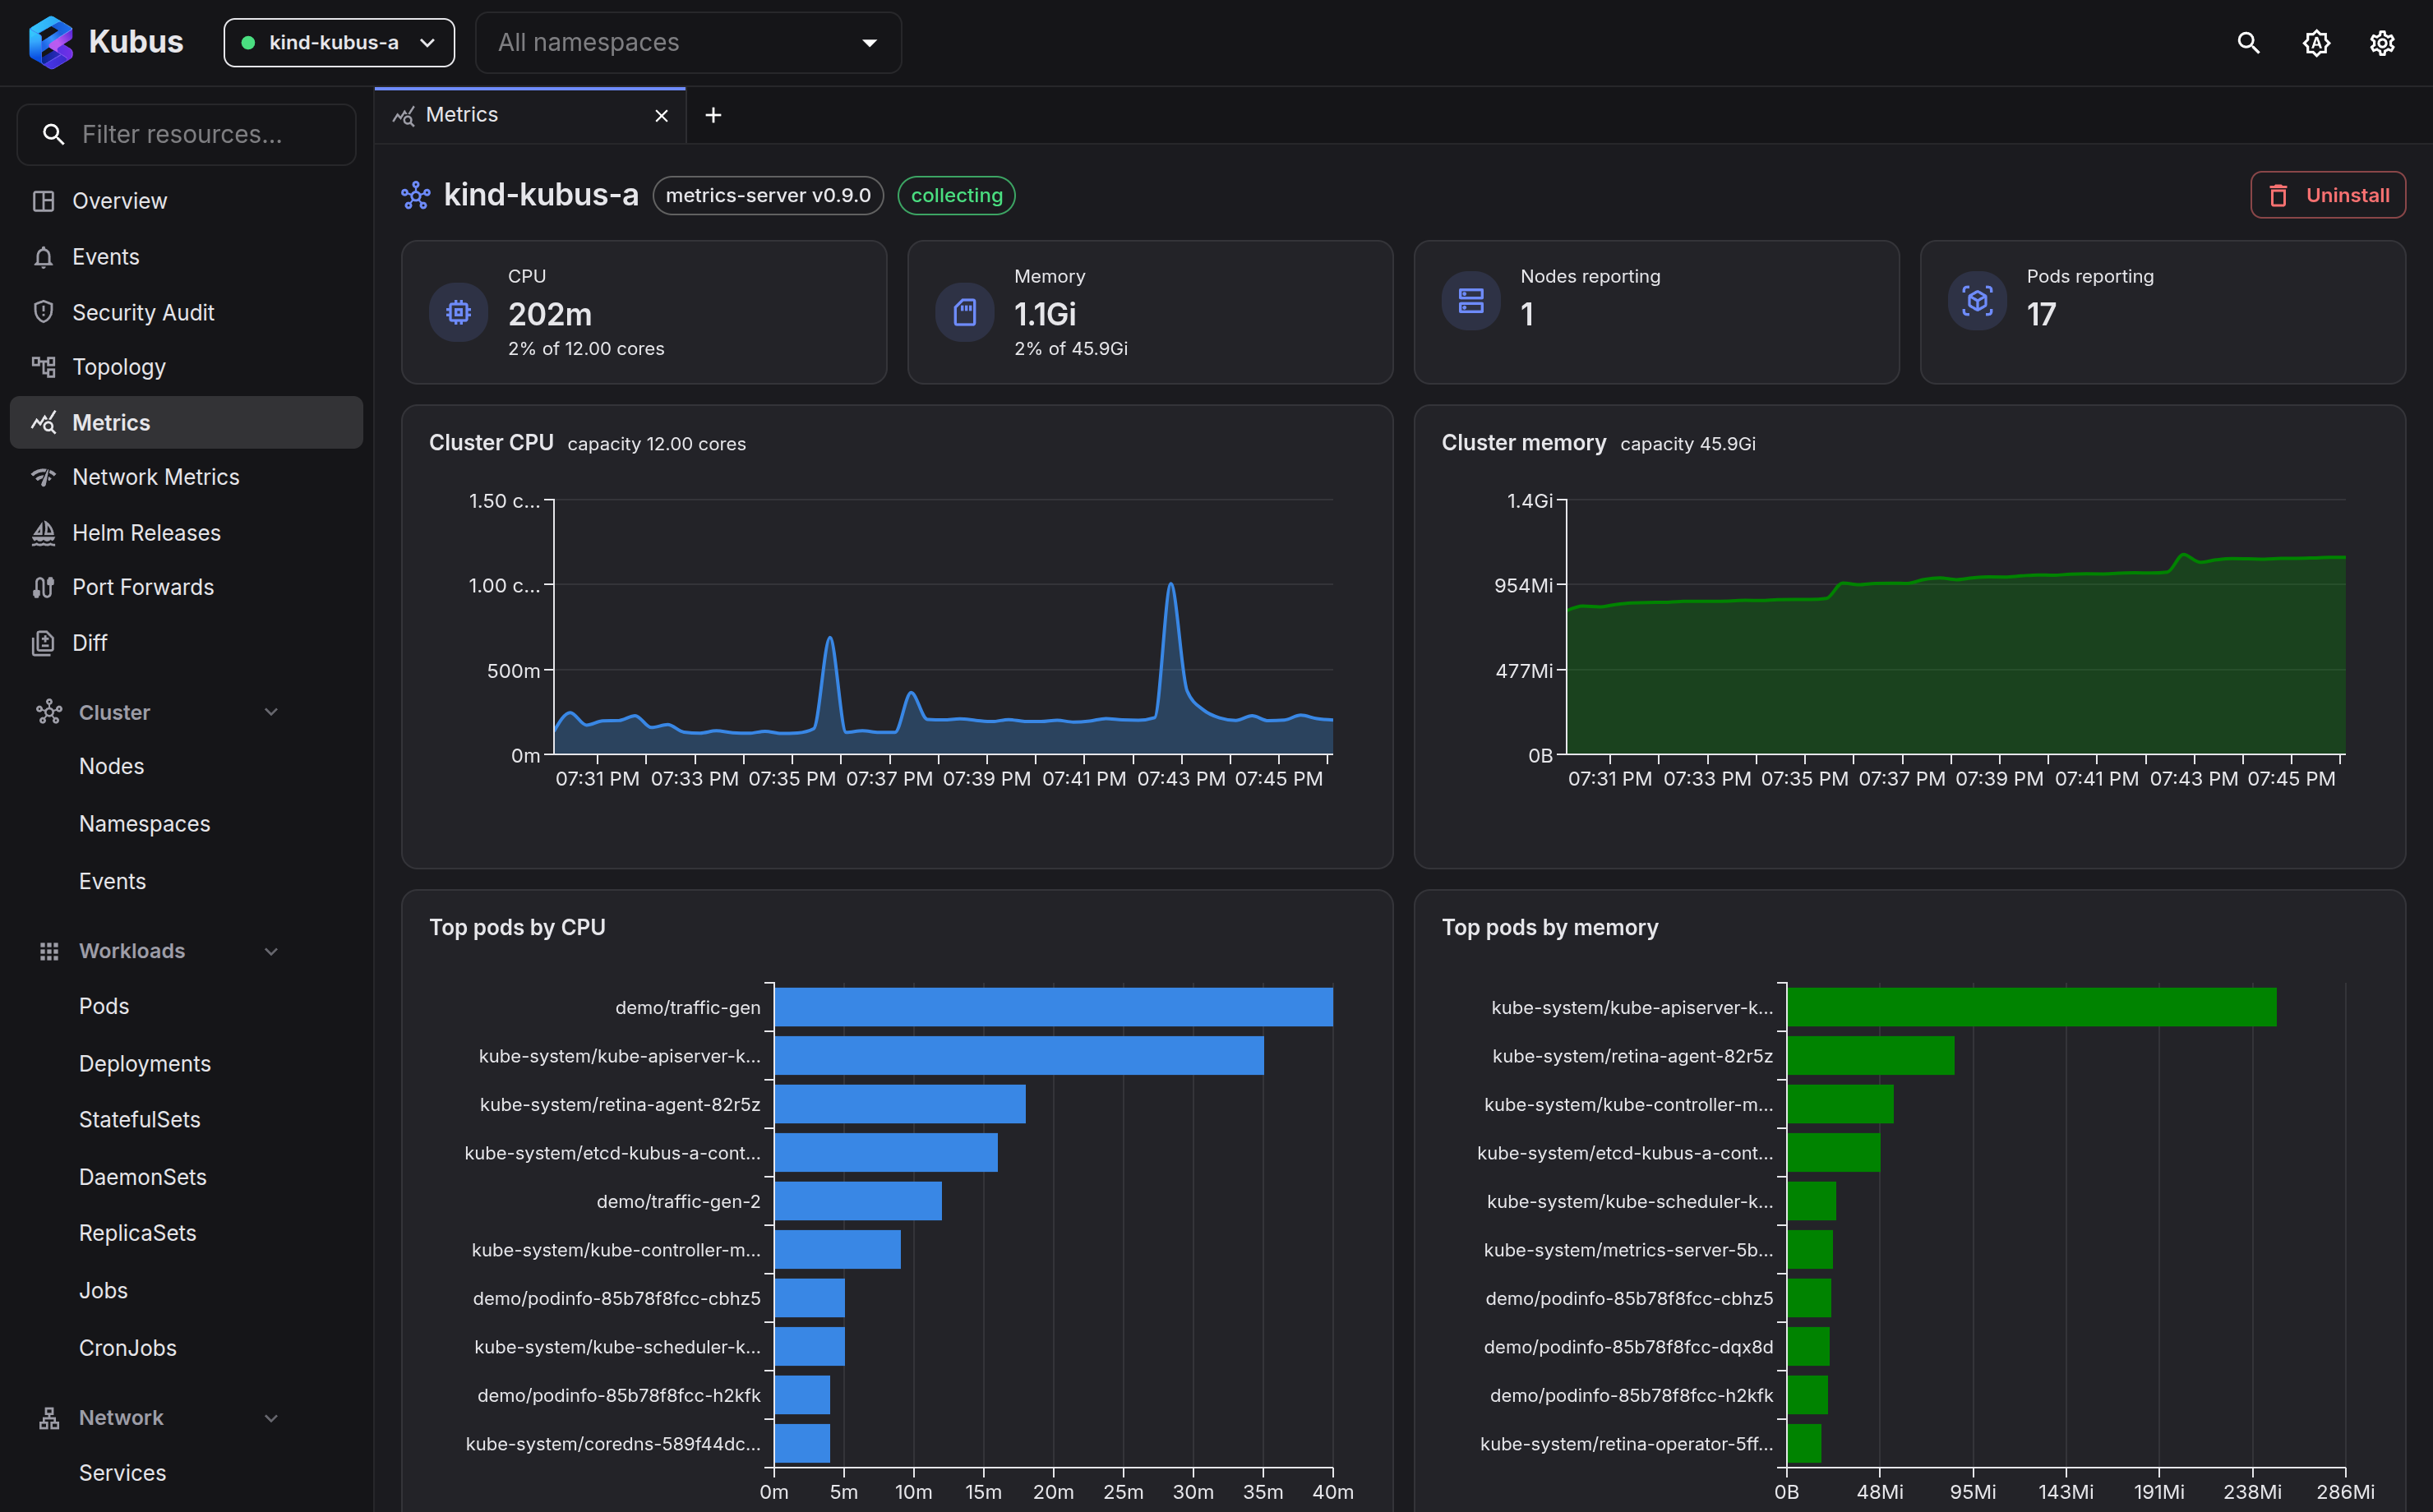
- Metrics page: the sidebar entry below Topology, with cluster-wide CPU/memory trends, per-node lines, top pods, and a per-namespace breakdown for every selected cluster. Top pods and namespaces are ranked lists: the name first, its namespace or pod count underneath, then a bar, the value and its share of the cluster's capacity. CPU is drawn in blue and memory in violet, so green, amber and red keep meaning healthy, degraded and failing. If a cluster has no metrics-server yet, the page offers a one-click install instead.
- Details drawer → Metrics tab: live CPU/memory charts for Pods and Nodes, with the current value called out.
- Resource lists: CPU and memory columns on the Pods list.
- Overview dashboard: the cluster's total CPU and memory use, then one row per node. More →
History accumulates while Kubus is open, so the first samples appear within ~20 seconds of opening a chart and fill in from there.
Installing metrics-server from Kubus
If a cluster has no metrics-server, Kubus can install it for you without kubectl or
Helm:
- On the Overview page, the Node usage card shows an Install metrics-server button whenever usage data is unavailable.
- The install dialog has one option: Skip kubelet TLS verification
(
--kubelet-insecure-tls). Enable it on local/dev clusters such as kind, minikube and docker-desktop, whose kubelets serve self-signed certificates.
Kubus applies the official pinned components.yaml (Deployment, Service, RBAC and the
metrics.k8s.io APIService in kube-system) via server-side apply, and labels the
resources as managed by Kubus. Graphs appear within a minute of the pod becoming ready.
Re-running the install is safe: it re-applies the same manifest, which also repairs a
broken install.
To remove it again, open the ⋮ menu in the Metrics page header and choose Uninstall metrics-server…. If the metrics-server wasn't installed by Kubus (k3s bundles one; cloud distributions often manage their own), Kubus warns you first, since your distribution may recreate it or expect removal through its own tooling.
If you prefer the CLI, the equivalent manual install is:
kubectl apply -f https://github.com/kubernetes-sigs/metrics-server/releases/latest/download/components.yaml
Without metrics-server
Kubus hides the charts and shows "Metrics unavailable". Every other feature works normally.
Controlling refresh
Metrics, events and the overview poll on a timer. You can speed that up or dial it back (or turn polling off) under Settings → Data & refresh. Watched lists stay live over their WebSocket regardless of this setting.
See also
- Overview dashboard shows node usage at a glance.
- Events often explain what caused a spike.