Overview dashboard
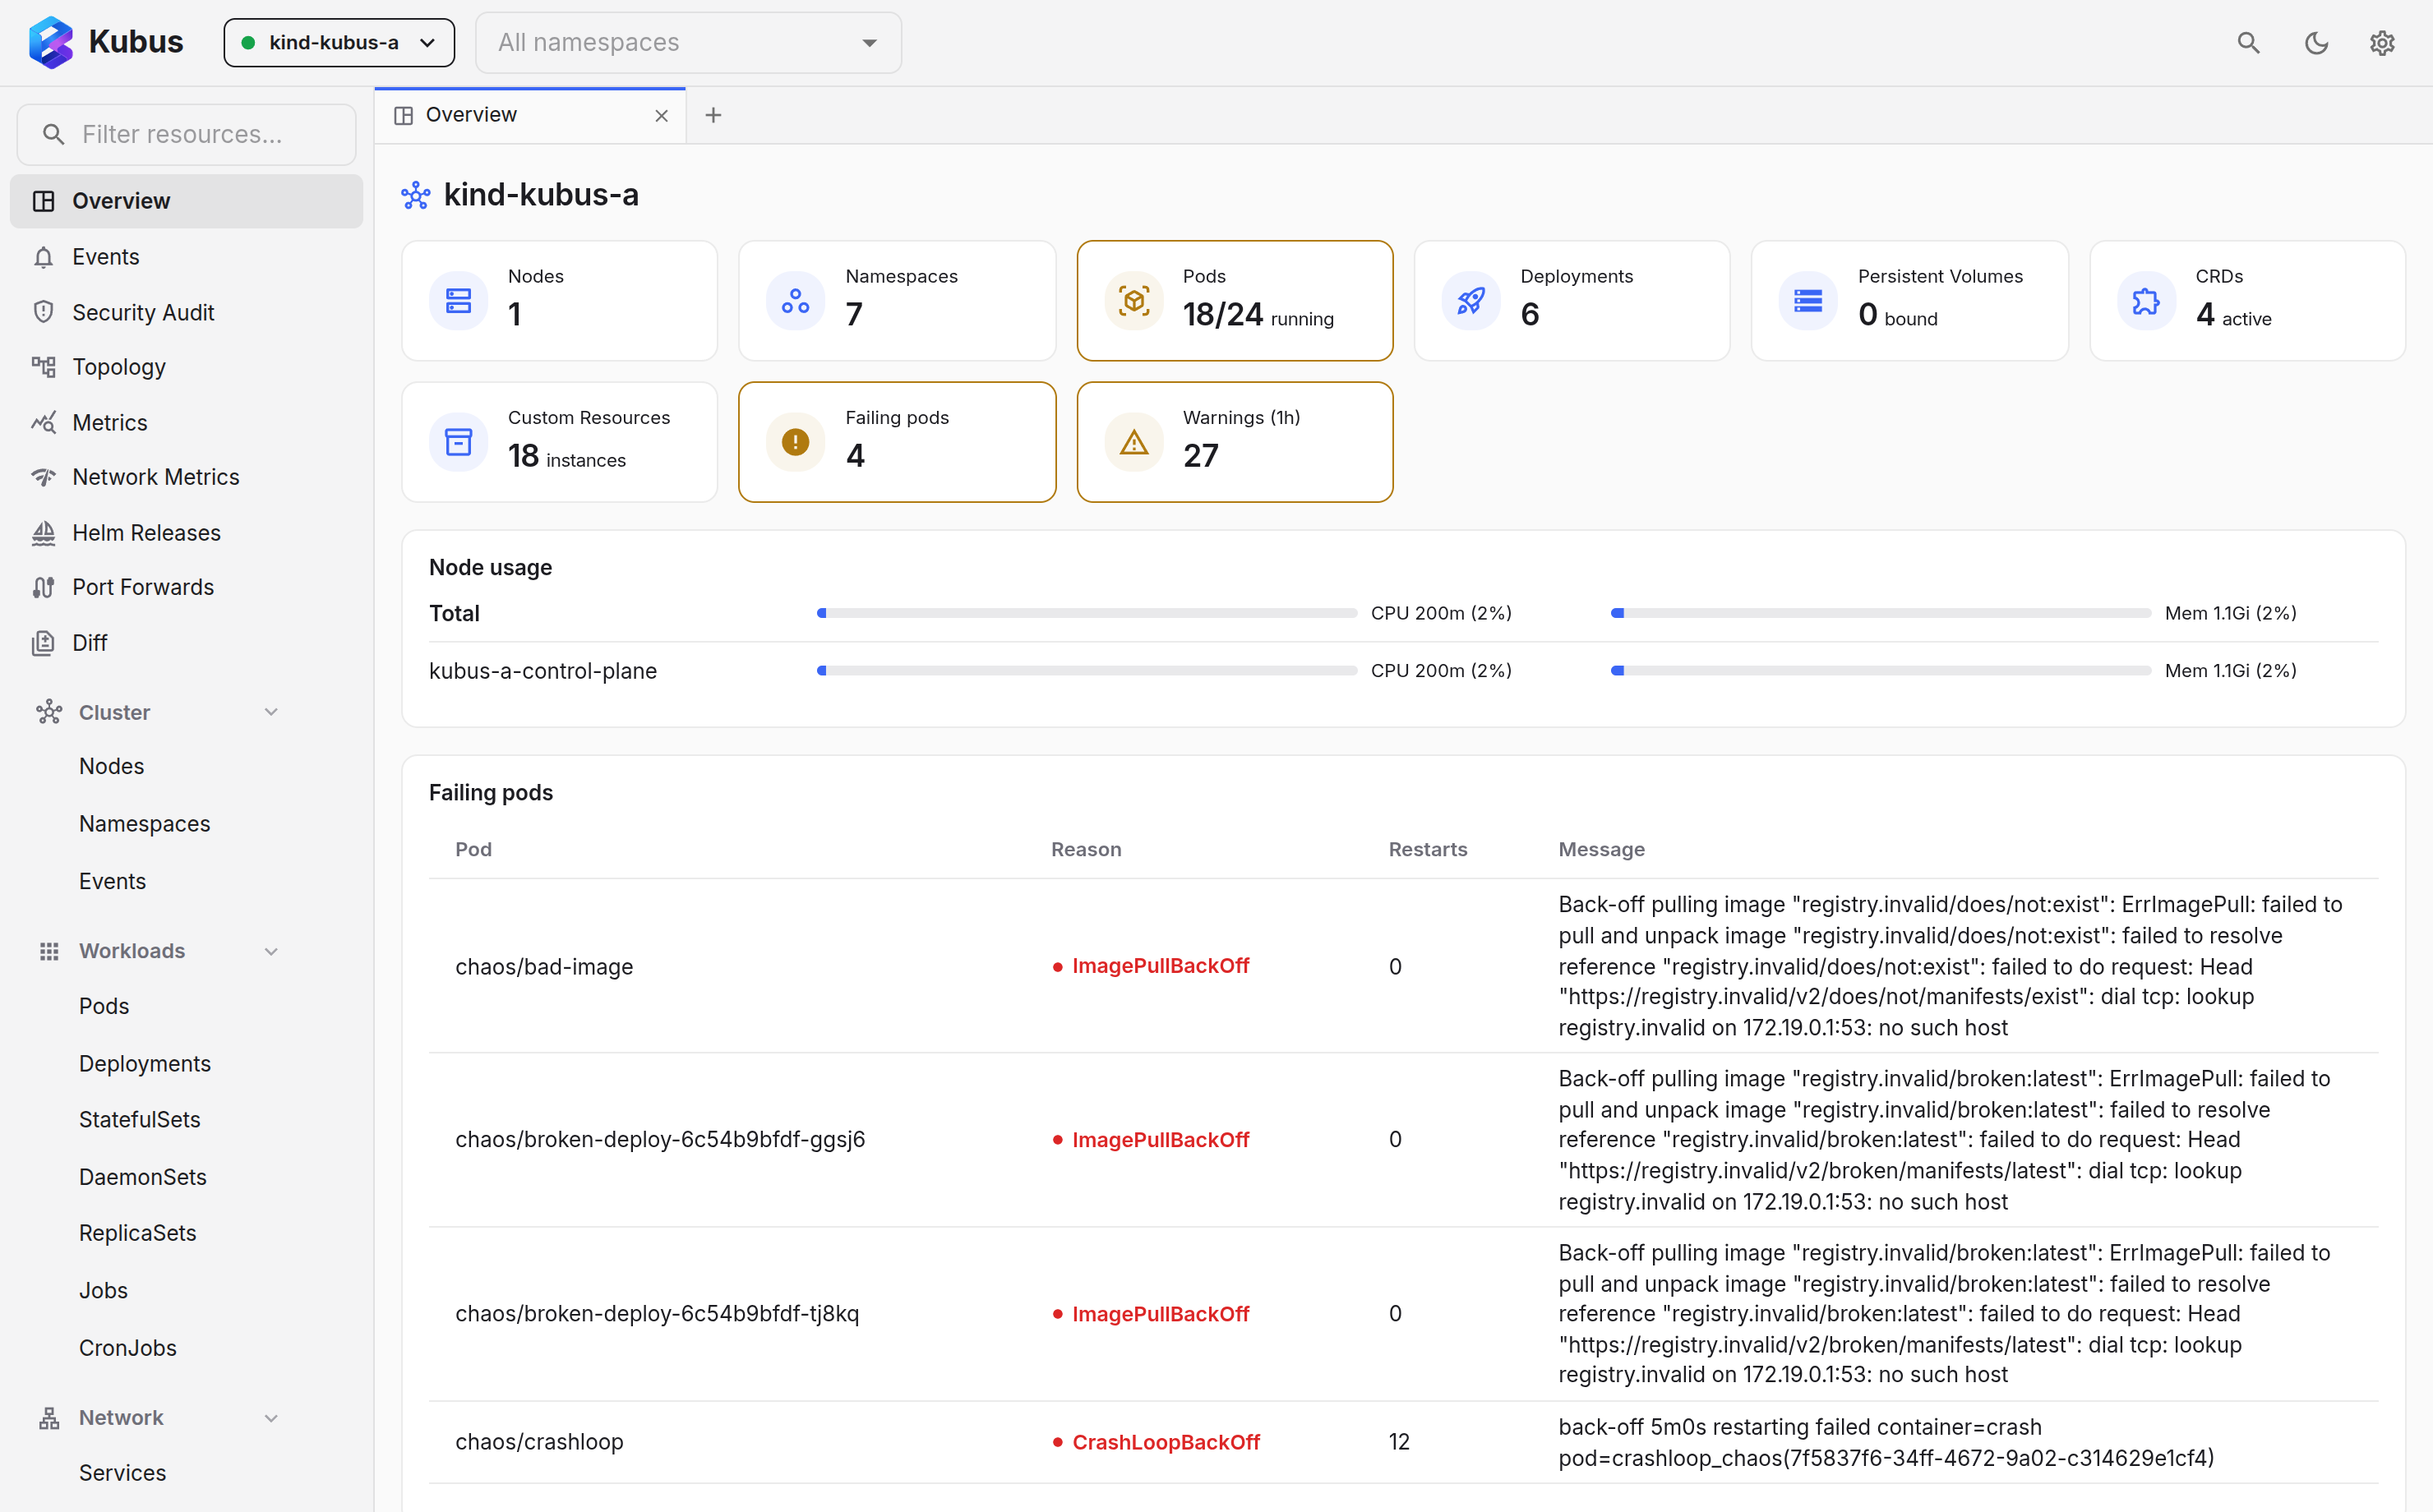
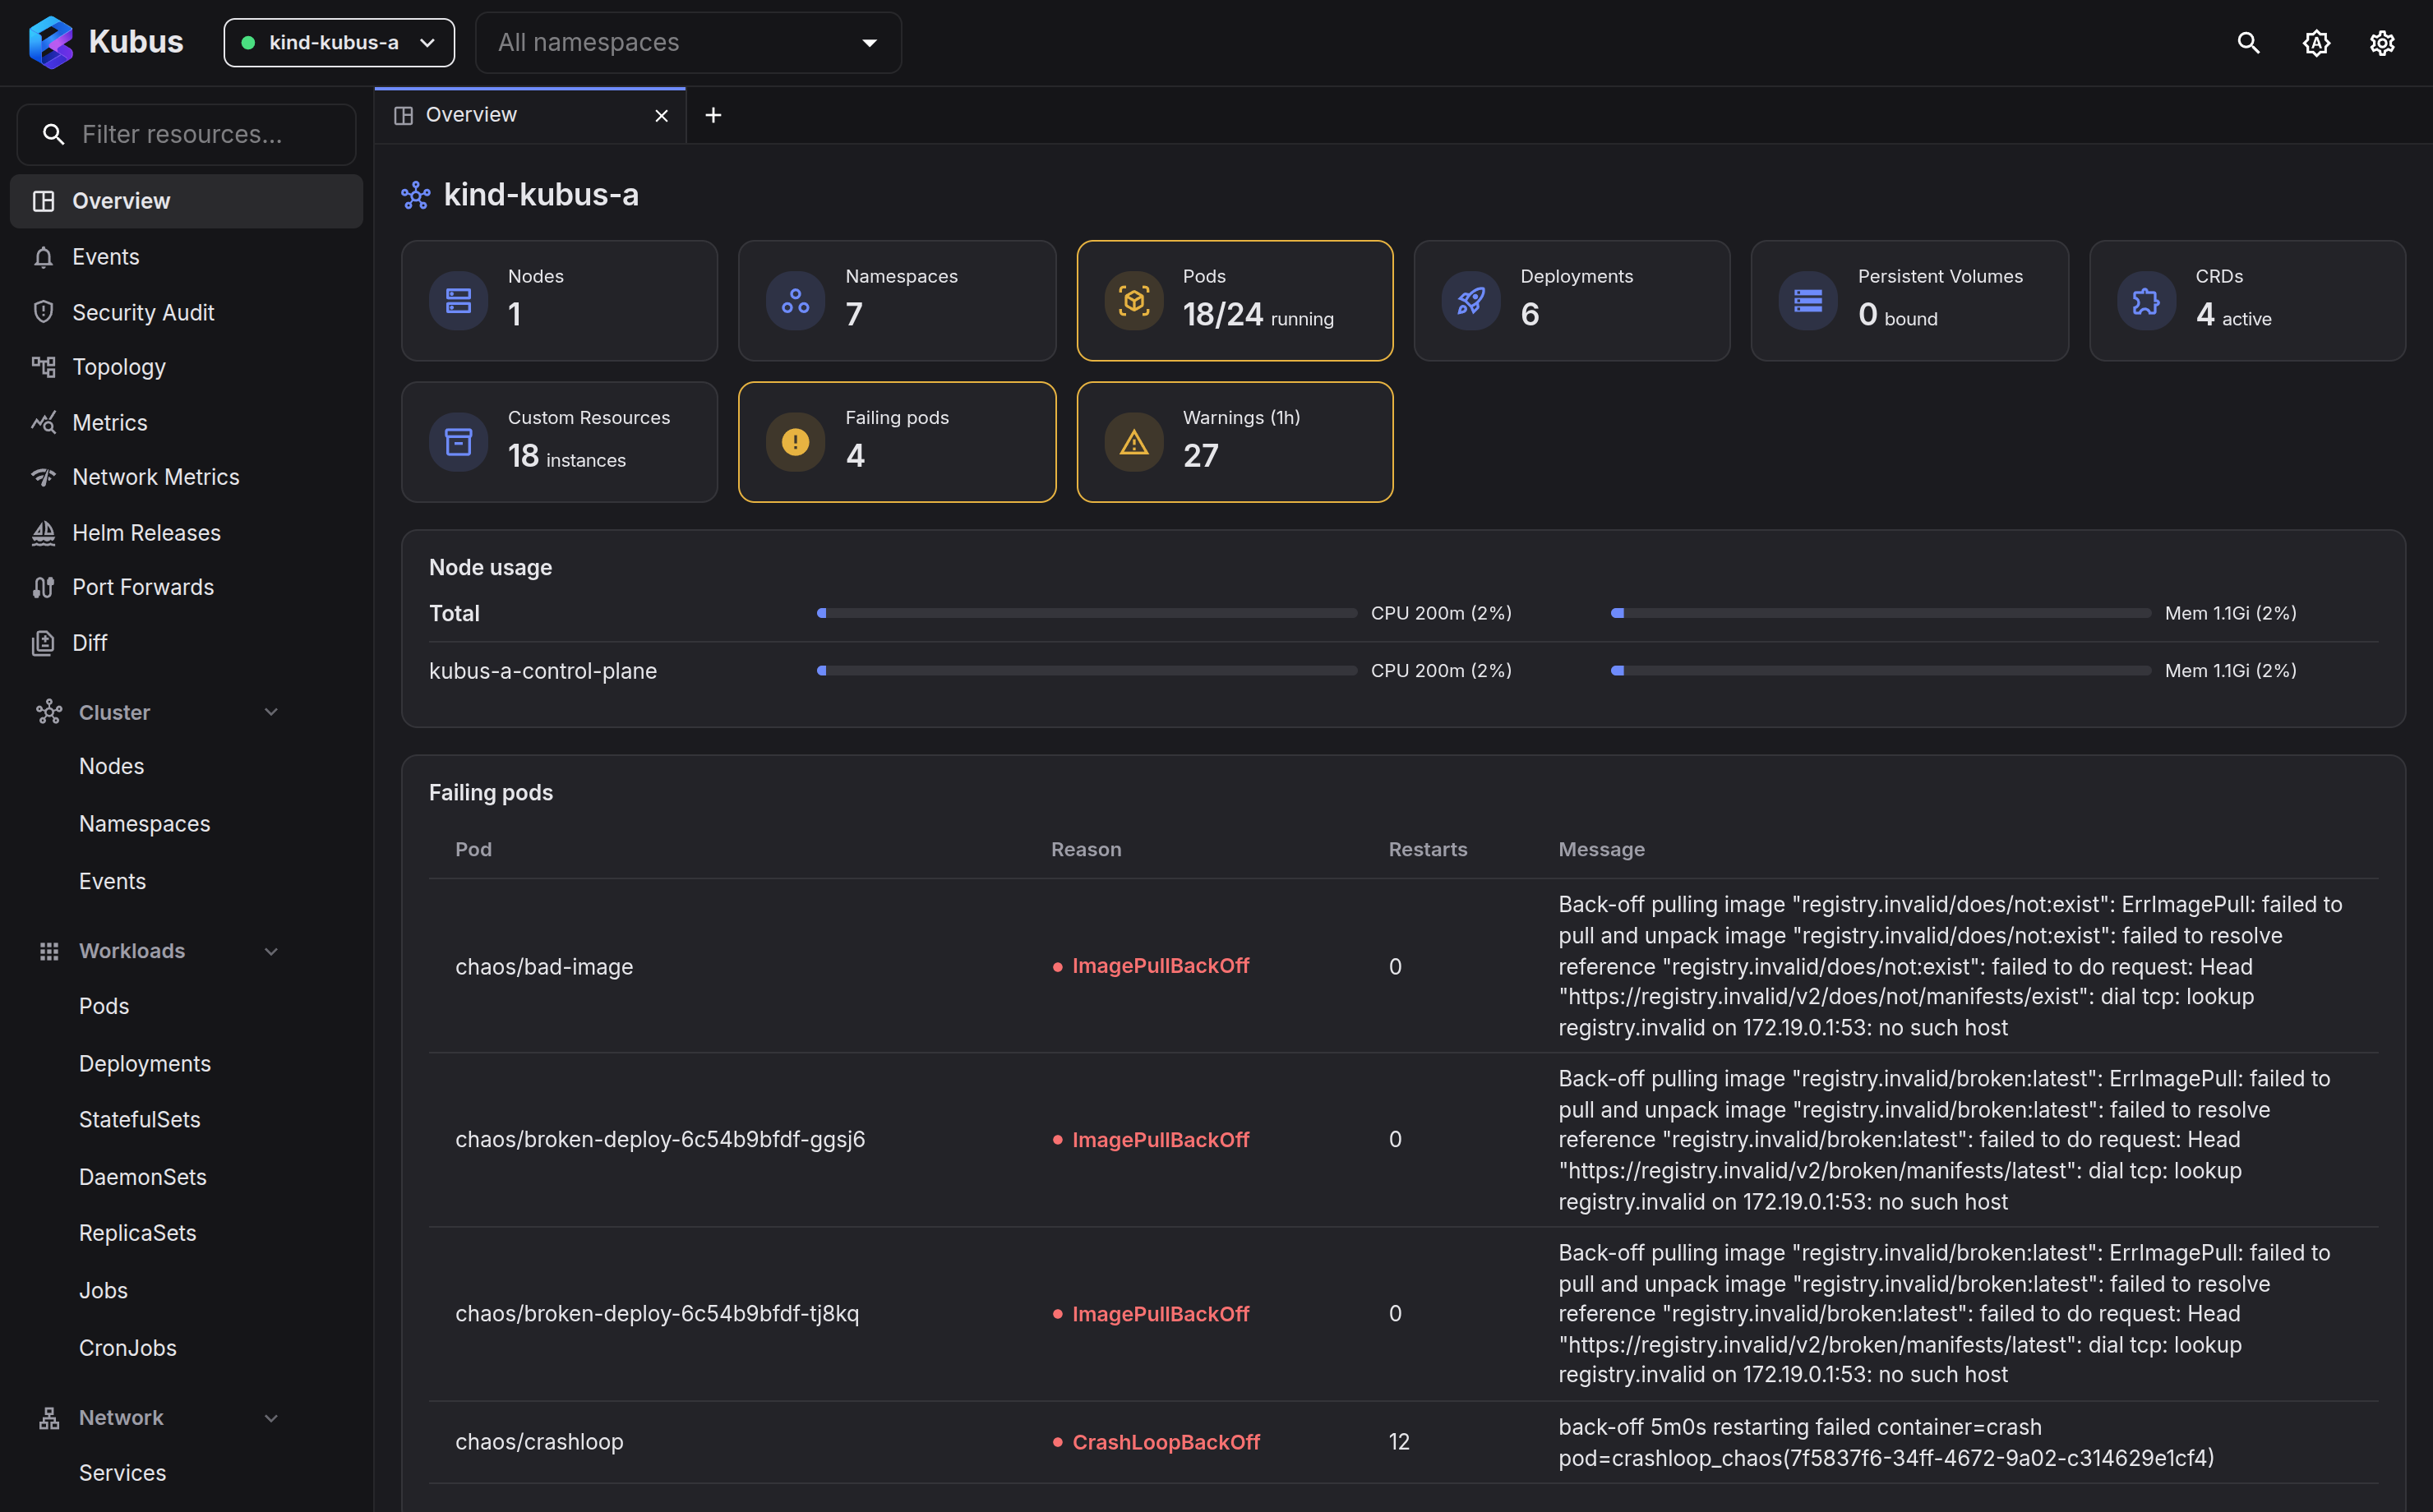
The Overview is the first thing you see, and the fastest way to answer "is anything on fire?" It summarises the health of every selected cluster on one screen.
What each cluster section shows
For every selected cluster you get, from the top:
- Needs attention: one tile per kind of trouble, and only for trouble that exists.
Failing pods (with a breakdown such as
4 ImagePull · 3 CrashLoop · 2 Pending), unhealthy workloads by kind, warnings of the last hour with their most frequent reasons, certificates that expire within 30 days, and operator resources that are not ready. Red tiles mean something is down, amber ones mean it is degraded. Each tile says where it takes you: Show pods opens the Pods list narrowed to the broken ones, Jump to list scrolls to the section below that lists them. When nothing needs attention, a single line says so. If Kubus could not read some kinds (no access, or the API isn't served), that line names them, because it can't vouch for them. -
Inventory, in two rows, each button opening its list:
- Cluster: nodes, namespaces, persistent volumes (bound, with the unbound ones in amber), CRDs and TLS certificates. The certificate count covers cert-manager Certificates and TLS Secrets and says how many expire soon; it opens the cert-manager Certificates list, or the Secrets list without cert-manager.
- Workloads: pods (running out of all), then every kind Kubus checks for health: Deployments, StatefulSets, DaemonSets, Jobs, CronJobs, autoscalers (HPAs), PersistentVolumeClaims (PVCs), disruption budgets (PDBs) and quotas. A kind with unhealthy objects shows how many and opens its list narrowed to them. Empty kinds are dimmed.
A kind Kubus cannot list shows no access (or unavailable) instead of a count. - Node usage: CPU and memory in use across the cluster as two large meters, with the used and total amounts, then one row per node, busiest first. The first eight nodes show until you ask for the rest. On a single-node cluster the meters are that node. Usage over time opens the metrics page. - Unhealthy workloads: every Deployment, StatefulSet, DaemonSet, Job, CronJob, PersistentVolumeClaim, autoscaler, disruption budget or quota that isn't healthy, with the actual reason. Kubus reads it from the workload's pods and events, so you see
ImagePullBackOff · registry.invalid/app:1: registry host not foundorFailedCreate · quota gpu-quota caps requests.nvidia.com/gpu at 0instead of a bare Unavailable. The heading lists the counts per kind (Deployments 3/18), each linking to that list narrowed to the unhealthy ones. - Operator rollups, expiring certificates, pod usage against requests and limits, failing pods with their messages, recent restarts and warning events.
Names are links: a workload, pod or event object opens in the details drawer.
Several clusters
With more than one cluster selected, each cluster starts as a one-line summary so they
all fit on one screen. The summary shows the cluster's colour from the cluster picker,
its connection state and Kubernetes version, how many nodes and namespaces it has, pods
running out of all, and CPU and memory in use across its nodes. On the right it lists
what needs attention as short counts (3 failing pods, 12 warnings (1h)), or says
Healthy. A cluster Kubus cannot reach says Unreachable with the reason.
Click a summary to open the cluster's full section below it, and click it again to close it. Kubus remembers which clusters you opened. Expand all and Collapse all in the page header open or close every cluster at once. With a single cluster selected, its section is always open.
A cluster with a namespace filter summarises those namespaces: their pods, deployments and what needs attention in them.
Scoped to a namespace
Pick one or more namespaces in the namespace filter and a cluster's section keeps the same layout, scoped to those namespaces:
- Needs attention counts only what lives there. It adds a tile for other resources that aren't healthy when a kind outside the usual checks has problems (a failing custom resource without an operator rollup, for example).
- Inventory becomes a
kubectl get all -n: one button per kind with objects in it, including the popular custom resources you have installed (cert-manager, Argo, Flux, KEDA, Gateway API routes and others). Kinds with a notion of health show how many objects are failed (red) or degraded (amber) next to the count, and a kind Kubus cannot read says no access. Show N empty kinds lists the kinds with nothing in them. - Unhealthy workloads, operator rollups, expiring certificates, resource quotas as usage bars, pod usage against requests and limits, failing pods and warning events.
Every inventory button opens that kind's list. The list keeps the same namespace filter, so you land on exactly the objects the button counted.
What counts as degraded or failed:
| Kind | Degraded | Failed |
|---|---|---|
| Pods | Not ready yet, or Pending for under five minutes | Crash-looping, image pull errors, Failed, or Pending for longer |
| Deployments, StatefulSets, DaemonSets, ReplicaSets | Some replicas unavailable | No replica available |
| Jobs, CronJobs | The Job, or the CronJob's latest run, failed | |
| PersistentVolumeClaims | Not bound yet | Lost |
| ResourceQuotas | A resource at 90% or more | A resource at its hard limit |
| HorizontalPodAutoscalers, PodDisruptionBudgets | Cannot scale, or blocks every eviction | |
| Custom resources | Ready still unknown, Argo sync drift or a progressing rollout |
Ready is False, Argo health degraded, or a route a gateway rejected |
The same inventory heads the Overview tab of a Namespace in the details drawer, so opening a namespace from the Namespaces list shows what lives inside it.
Reading the signals
| You see… | It usually means… |
|---|---|
Failing pods with ImagePullBackOff / ErrImagePull |
A bad image reference or missing pull secret. |
Failing pods with CrashLoopBackOff |
The container keeps exiting. Check its logs. |
Pending pods |
Nothing can schedule them. Check node capacity or taints. The owning workload's drawer spells out the scheduler's reason. |
| Warnings climbing | Look at the events timeline for the reason and the involved object. |
Multi-cluster triage
With several clusters selected, the Overview stacks one section per cluster. Scan the Needs attention rows top to bottom; the one with red tiles is where to start. The nav shows the same problems as badges next to Pods, Deployments and the other kinds.
No metrics yet?
If the Node usage card says CPU and memory usage are unavailable, click Install metrics-server next to the message, or install it yourself:
kubectl apply -f https://github.com/kubernetes-sigs/metrics-server/releases/latest/download/components.yaml
On kind and some managed clusters you also need the --kubelet-insecure-tls flag. See
Metrics & health for details.
See also
- Events has the full, filterable timeline behind the warnings count.
- Metrics & health has per-pod and per-node history charts.