Network metrics
Kubus can show live traffic between your pods: who talks to whom, and at what rate. It needs no Prometheus, service mesh, or specific CNI.
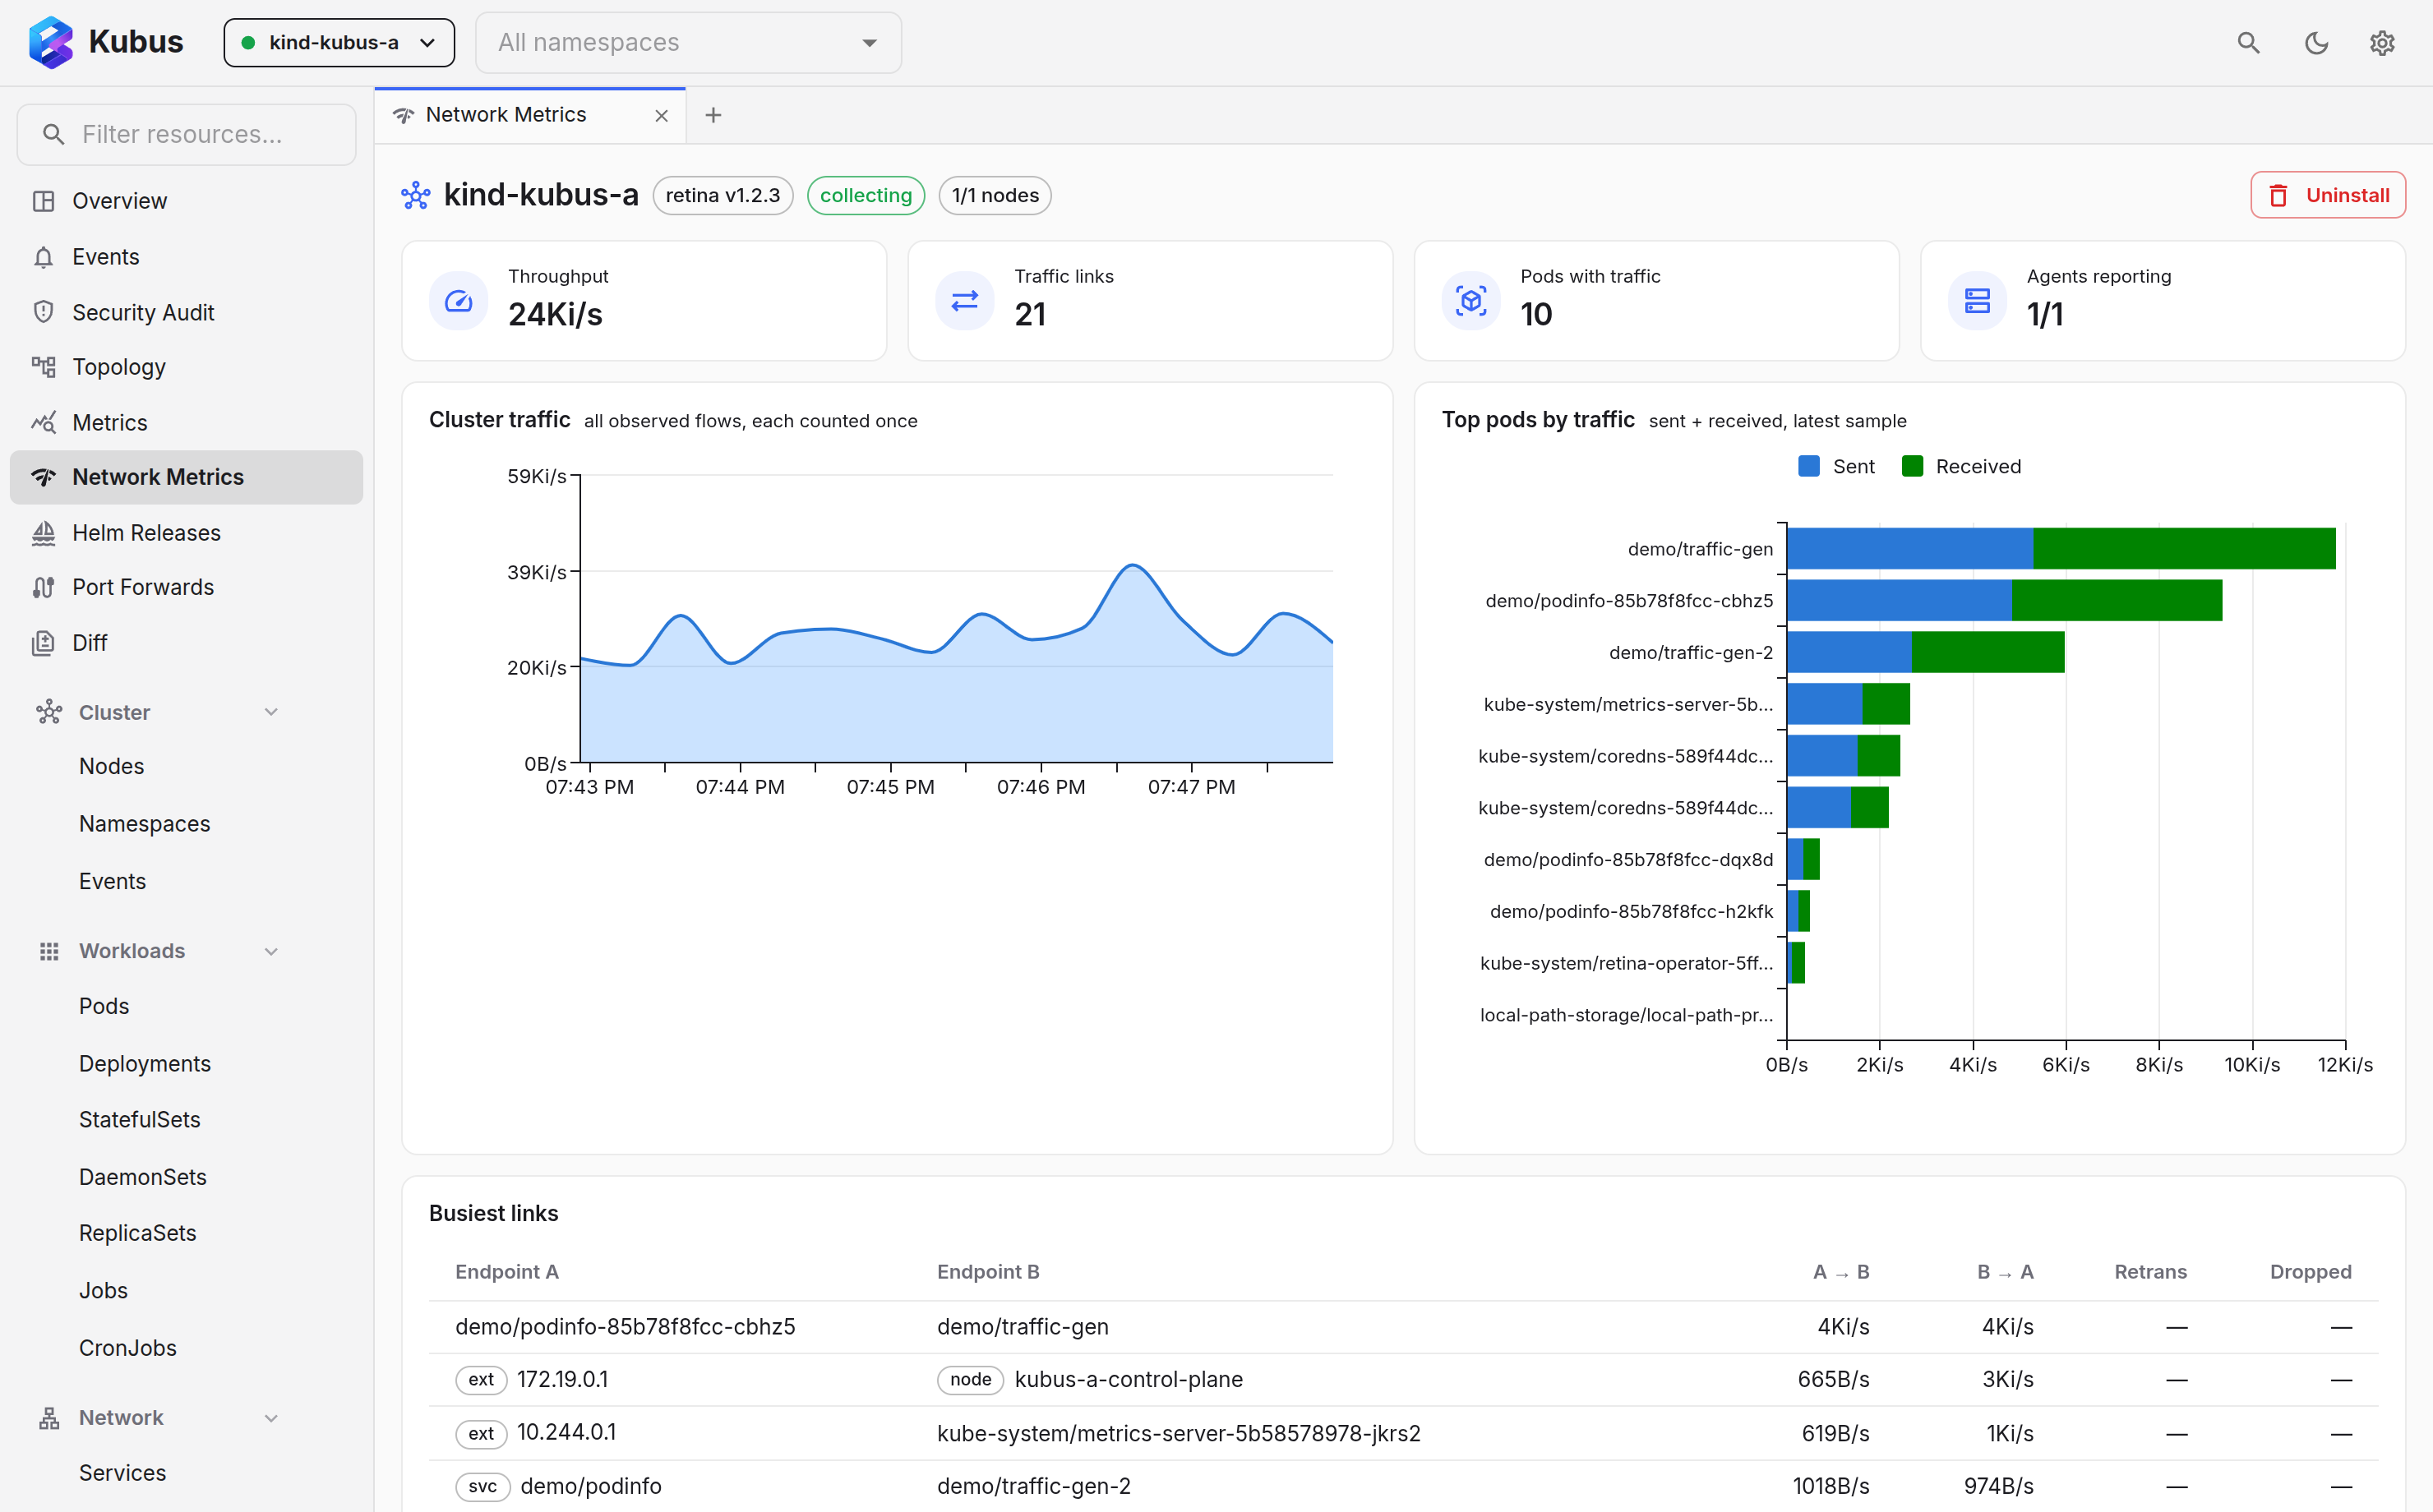
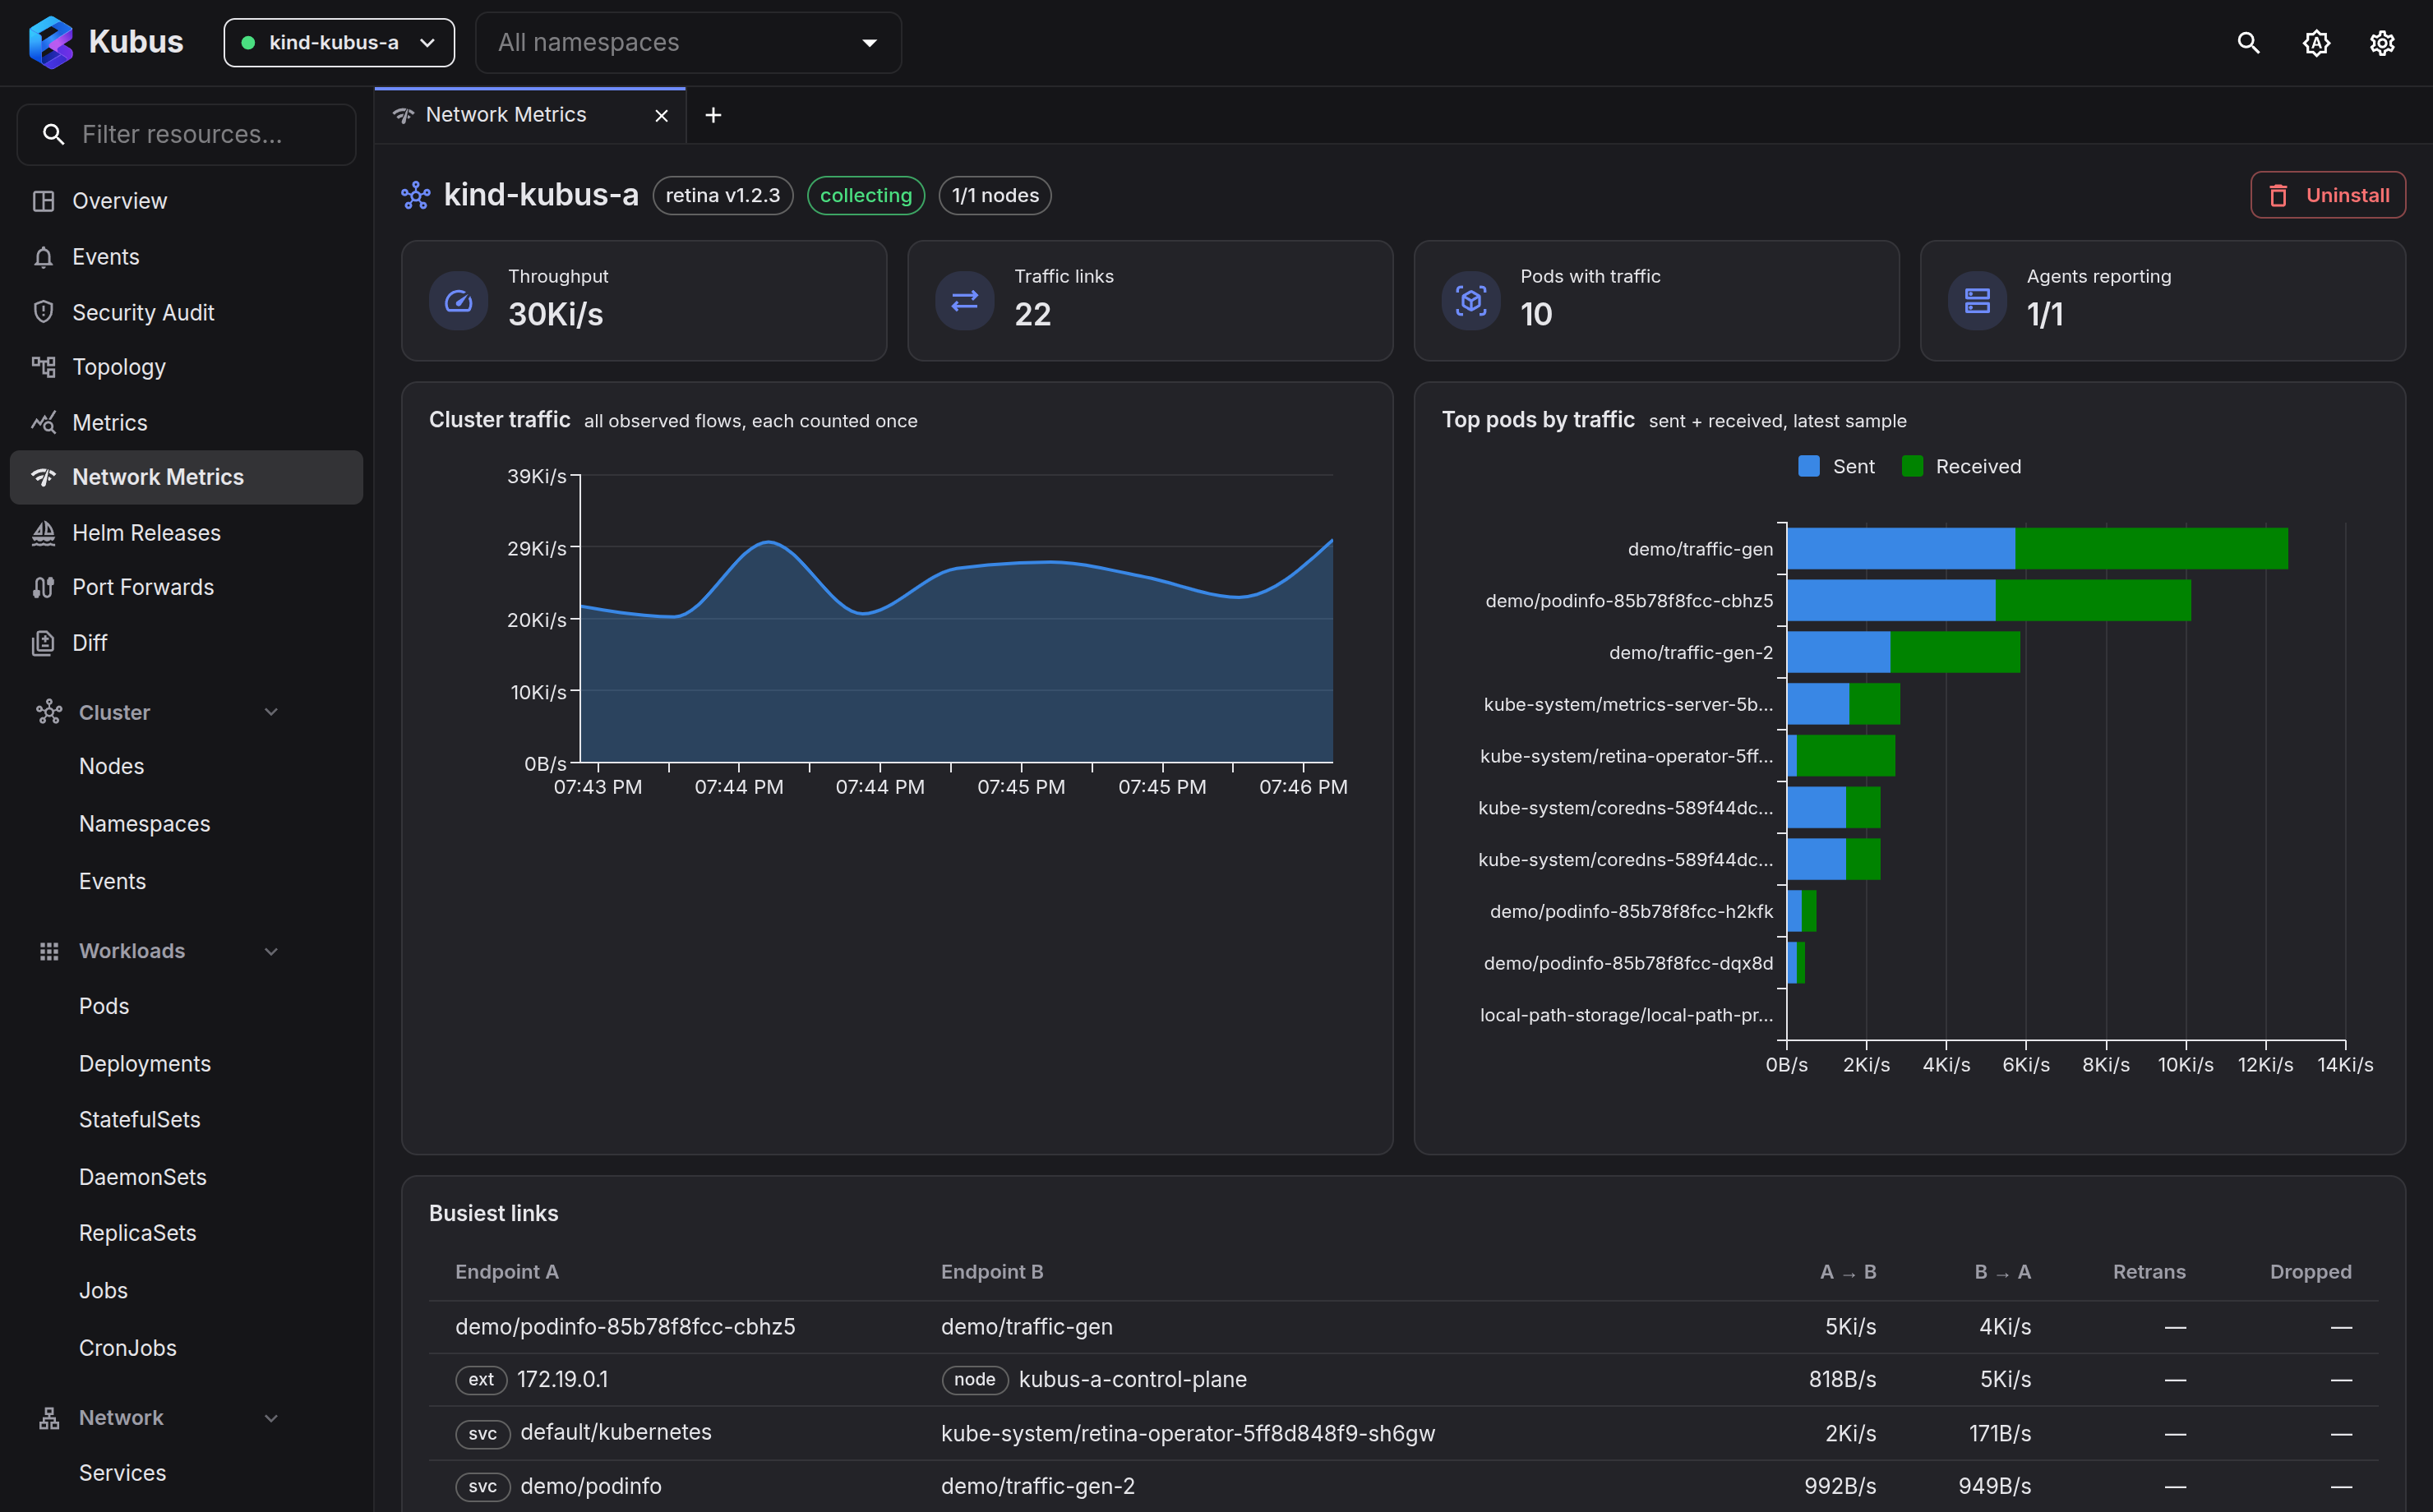
The data comes from Microsoft Retina (open source, Apache-2.0), an eBPF network-observability agent that Kubus deploys on demand. Kubus scrapes each agent through the Kubernetes API-server pod proxy, so no extra network paths or credentials are involved. If your kubeconfig can reach the cluster, the traffic view works. Retina attributes traffic by IP, so it also works on local clusters like kind.
What the page shows
The Network Metrics sidebar entry (below Metrics) renders, per selected cluster:
- Tiles show cluster-wide throughput, active traffic links, pods with traffic, and how many node agents are reporting.
- Cluster traffic plots a rolling ~30-minute throughput trend (each flow counted once).
- Top pods by traffic ranks the busiest pods: the pod name with its namespace underneath, a bar with sent and received stacked, and the combined rate with the sent (↑) and received (↓) rates under it. Hover the bar for both exact rates.
- Busiest links is a table of endpoint pairs with per-second rates in each direction, plus TCP retransmissions and dropped bytes when they occur. Endpoints are shown as pods where Retina resolved them; other IPs resolve to Services (ClusterIP), nodes, or show as the raw IP.
Links are direction-neutral. The agent observes packets and can't tell which side opened the connection, so each link shows A→B and B→A rates. Rates are computed between agent scrapes (~20 s apart), and history accumulates while Kubus is open.
Installing the network agent
If the agent isn't installed, the page offers a one-click install instead. Kubus
applies a pinned, vendored render of the upstream Retina chart via server-side apply
into kube-system (the same namespace Retina's own chart uses): the eBPF agent
DaemonSet, a small operator Deployment, two retina.sh CRDs and their RBAC, all
labeled as managed by Kubus. Re-running the install is safe: it re-applies the same
manifest, which also repairs a broken install.
A few things to know before installing:
- The agent pods use the host network and elevated capabilities (with a privileged init container), which eBPF needs. Linux nodes only.
- Retina's pod-level metrics require an explicit namespace list
(
MetricsConfigurationCRD). Kubus creates it for all namespaces and keeps it in sync automatically as namespaces come and go. - Expect roughly 500m CPU / 300 Mi memory requested per node (upstream defaults).
To remove it again, open the ⋮ menu in the page header and choose Uninstall network agent…. It deletes everything the install created. If the Retina install wasn't created by Kubus (AKS add-ons, your own Helm release), a warning notes that it may be managed elsewhere.